
| 일 | 월 | 화 | 수 | 목 | 금 | 토 |
|---|---|---|---|---|---|---|
| 1 | 2 | 3 | 4 | |||
| 5 | 6 | 7 | 8 | 9 | 10 | 11 |
| 12 | 13 | 14 | 15 | 16 | 17 | 18 |
| 19 | 20 | 21 | 22 | 23 | 24 | 25 |
| 26 | 27 | 28 | 29 | 30 | 31 |
Tags
- tensorflow
- DANAWA
- matplotlib
- 자바스크립트
- Project
- keras
- visualizing
- 크롤링
- Scrum
- python
- javascript
- angular
- ECS
- webcrawling
- analyzing
- 애자일
- 다나와
- algorithm
- Method
- opencv
- data analyze
- TypeScript
- adaptive life cycle
- data
- 판다스
- 프로젝트
- AWS
- pandas
- Agile
- Crawling
Archives
- Today
- Total
LiJell's 성장기
__09.data_analyzing_visualizing_instagram (인스타그램 2편) 본문
Bigdata/Web Crawling
__09.data_analyzing_visualizing_instagram (인스타그램 2편)
All_is_LiJell 2022. 1. 17. 18:30반응형
- 인스타그램 1편 크롤링/전처리: https://lime-jelly.tistory.com/47
- 인스타그램 3편 시각화/지도: https://lime-jelly.tistory.com/50
'''
__08.data_analyzing_crawling_instagram (인스타그램 1편)
인스타그램 2편 전처리/시각화: https://lime-jelly.tistory.com/48 인스타그램 3편 시각화/지도: https://lime-jelly.tistory.com/50 __09.data_analyzing_visualizing_instagram (인스타그램 2편) 인스타그램 1..
lime-jelly.tistory.com
__10.data.analyzing_map_instagram(인스타그램 3편)
인스타그램 1편 크롤링/전처리: https://lime-jelly.tistory.com/47 인스타그램 2편 전처리/시각화: https://lime-jelly.tistory.com/48 파일 받아오기 주소 : https://github.com/Play-with-data/datasalon/tree/..
lime-jelly.tistory.com
Add/Modified on Jan 18 2022
'''
9. 인스타그램 데이터 비쥬얼라이징 (instagram data visualizing)
9.1. 해시태그 데이터
9.1.1. 데이터 불러오기
import pandas as pd
raw_total = pd.read_excel('./files/1_crawling_raw.xlsx')
raw_total['tags']
9.1.2. 해시태그 통합 저장하기
tags_total = []

for tags in raw_total['tags']:
    tags_list = tags[2:-2].split("', '") # 필요없는 부분 삭제
    for tag in tags_list:
        tags_total.append(tag)
tags_total
# 다른 방법
# raw_total['tags'][1].str[2:-2]
9.2. 해시태그 출현 빈도
from collections import Counter
tag_counts = Counter(tags_total)
type(tag_counts)
# collections.Counter
tag_counts- 상위 50개 찾아보기
tag_counts.most_common(50)9.3. 해시태그 정제하기
STOPWORDS = ['#일상', '#서귀포눈썹문신','#선팔','#제주도','#jeju','#반영구','#섭지코지','#제주자연눈썹','#서귀포눈썹문신','#제주눈썹문신', '#소통','#맞팔','#제주속눈썹','#제주일상','#여행스타그램','#눈썹문신','#카멜리아힐','#daily','#제주도민','#제주해안도로','#제주반영구','#제주시','#서귀포반영구','#서귀포속눈썹','#제주남자눈썹문신','#서귀포자연눈썹','#제주속눈썹연장','#서귀포남자눈썹문신']

tag_total_selected = []

for tag in tags_total:
    if not tag in STOPWORDS:
        tag_total_selected.append(tag)

tag_counts_selected = Counter(tag_total_selected)
tag_counts_selected.most_common(50)

# 모두 정제하진 못했어요 핳ㅎ..
9.4. 시각화하기
9.4.1. WordCloud
import matplotlib.pyplot as plt
import platform

from matplotlib import rc
import sys
import seaborn as sns

font_path = 'c://Windows/Fonts/malgun.ttf'
rc('font', family = font_path)
import wordcloud
from wordcloud import WordCloud
# 안되면
# ! pip install wordcloud
# 이것도 error 뜨면
# conda prompt에서 conda install -c conda-forge wordcloudwordcloud = WordCloud(font_path = font_path,
background_color = 'white',
width = 400,
height = 200,
relative_scaling = 0.3,
max_words = 100).generate_from_frequencies(tag_total_selected)
plt.figure(figsize = (10, 8))
plt.imshow(wordcloud)
plt.axis('off')
plt.savefig('./files/word_cloud_class.png') # 파일 저장
9.4.2. Bar plot
# 많아서 개수 줄였어요
tag_counts_df = pd.DataFrame(tag_counts_selected.most_common(30))
tag_counts_df.columns = ['tags', 'counts']
tag_counts_df.head()

# blank 지우기
tag_counts_df['tags'].replace(' ', None, inplace = True)
tag_counts_df['tags']

tag_counts_df.dropna(subset = ['tags'], inplace = True)
plt.figure(figsize = (10, 8))
sns.barplot(x = 'counts', y = 'tags', data = tag_counts_df)
plt.show()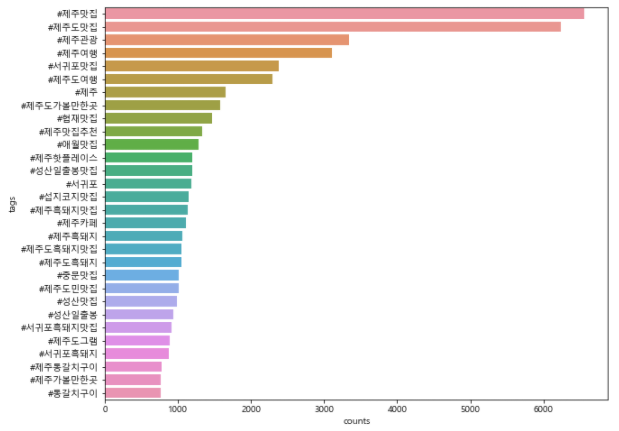
반응형
'Bigdata > Web Crawling' 카테고리의 다른 글
| __11.data_analyzing_Starbucks_crawling (스타벅스 1편) (0) | 2022.01.19 |
|---|---|
| __10.data.analyzing_map_instagram(인스타그램 3편) (2) | 2022.01.18 |
| __08.data_analyzing_crawling_instagram (인스타그램 1편) (0) | 2022.01.17 |
| __07.data_analyzing_visualizing_tourist_data (한국 관광객 추이 2편) (0) | 2022.01.17 |
| __06.data_analyzing_tourist_data (한국 관광객 추이 1편) (0) | 2022.01.14 |
'Bigdata/Web Crawling' Related Articles
more


Comments